PREMER forest survey
PREMER01 / 13
Goč · drone LiDAR · 6 September 2024 · live point cloud
PREMER

A full forest inventory. From the air.

Every tree countedHeight, crown, timber volumeViewed in a browser
Drone + laser → point cloud → tree by tree
loading 760,000 points…
trees extracted0
How forests are measured today

Forests are measured by sample.
Decisions apply to all of it.

Real data · Goč
  • Sample plots. Calipers and a hypsometer on a few circular plots per compartment, then an estimate for the whole area.
  • A job for a field crew. Days on foot, and the result is a table that stands until the next management plan.
  • In a poplar plantation the number of living trees and the gaps only show up on a site visit, and the real volume only at the timber yard.
  • LiDAR measures every crown. It does not estimate from a sample. It measures the whole area.
One flight

A drone with a laser flies over the forest and measures everything at once.

This is a real survey of Goč mountain in Serbia. The laser fires hundreds of thousands of pulses per second. Some bounce off the crown, some pass through the leaves to the branches, and some reach the ground.
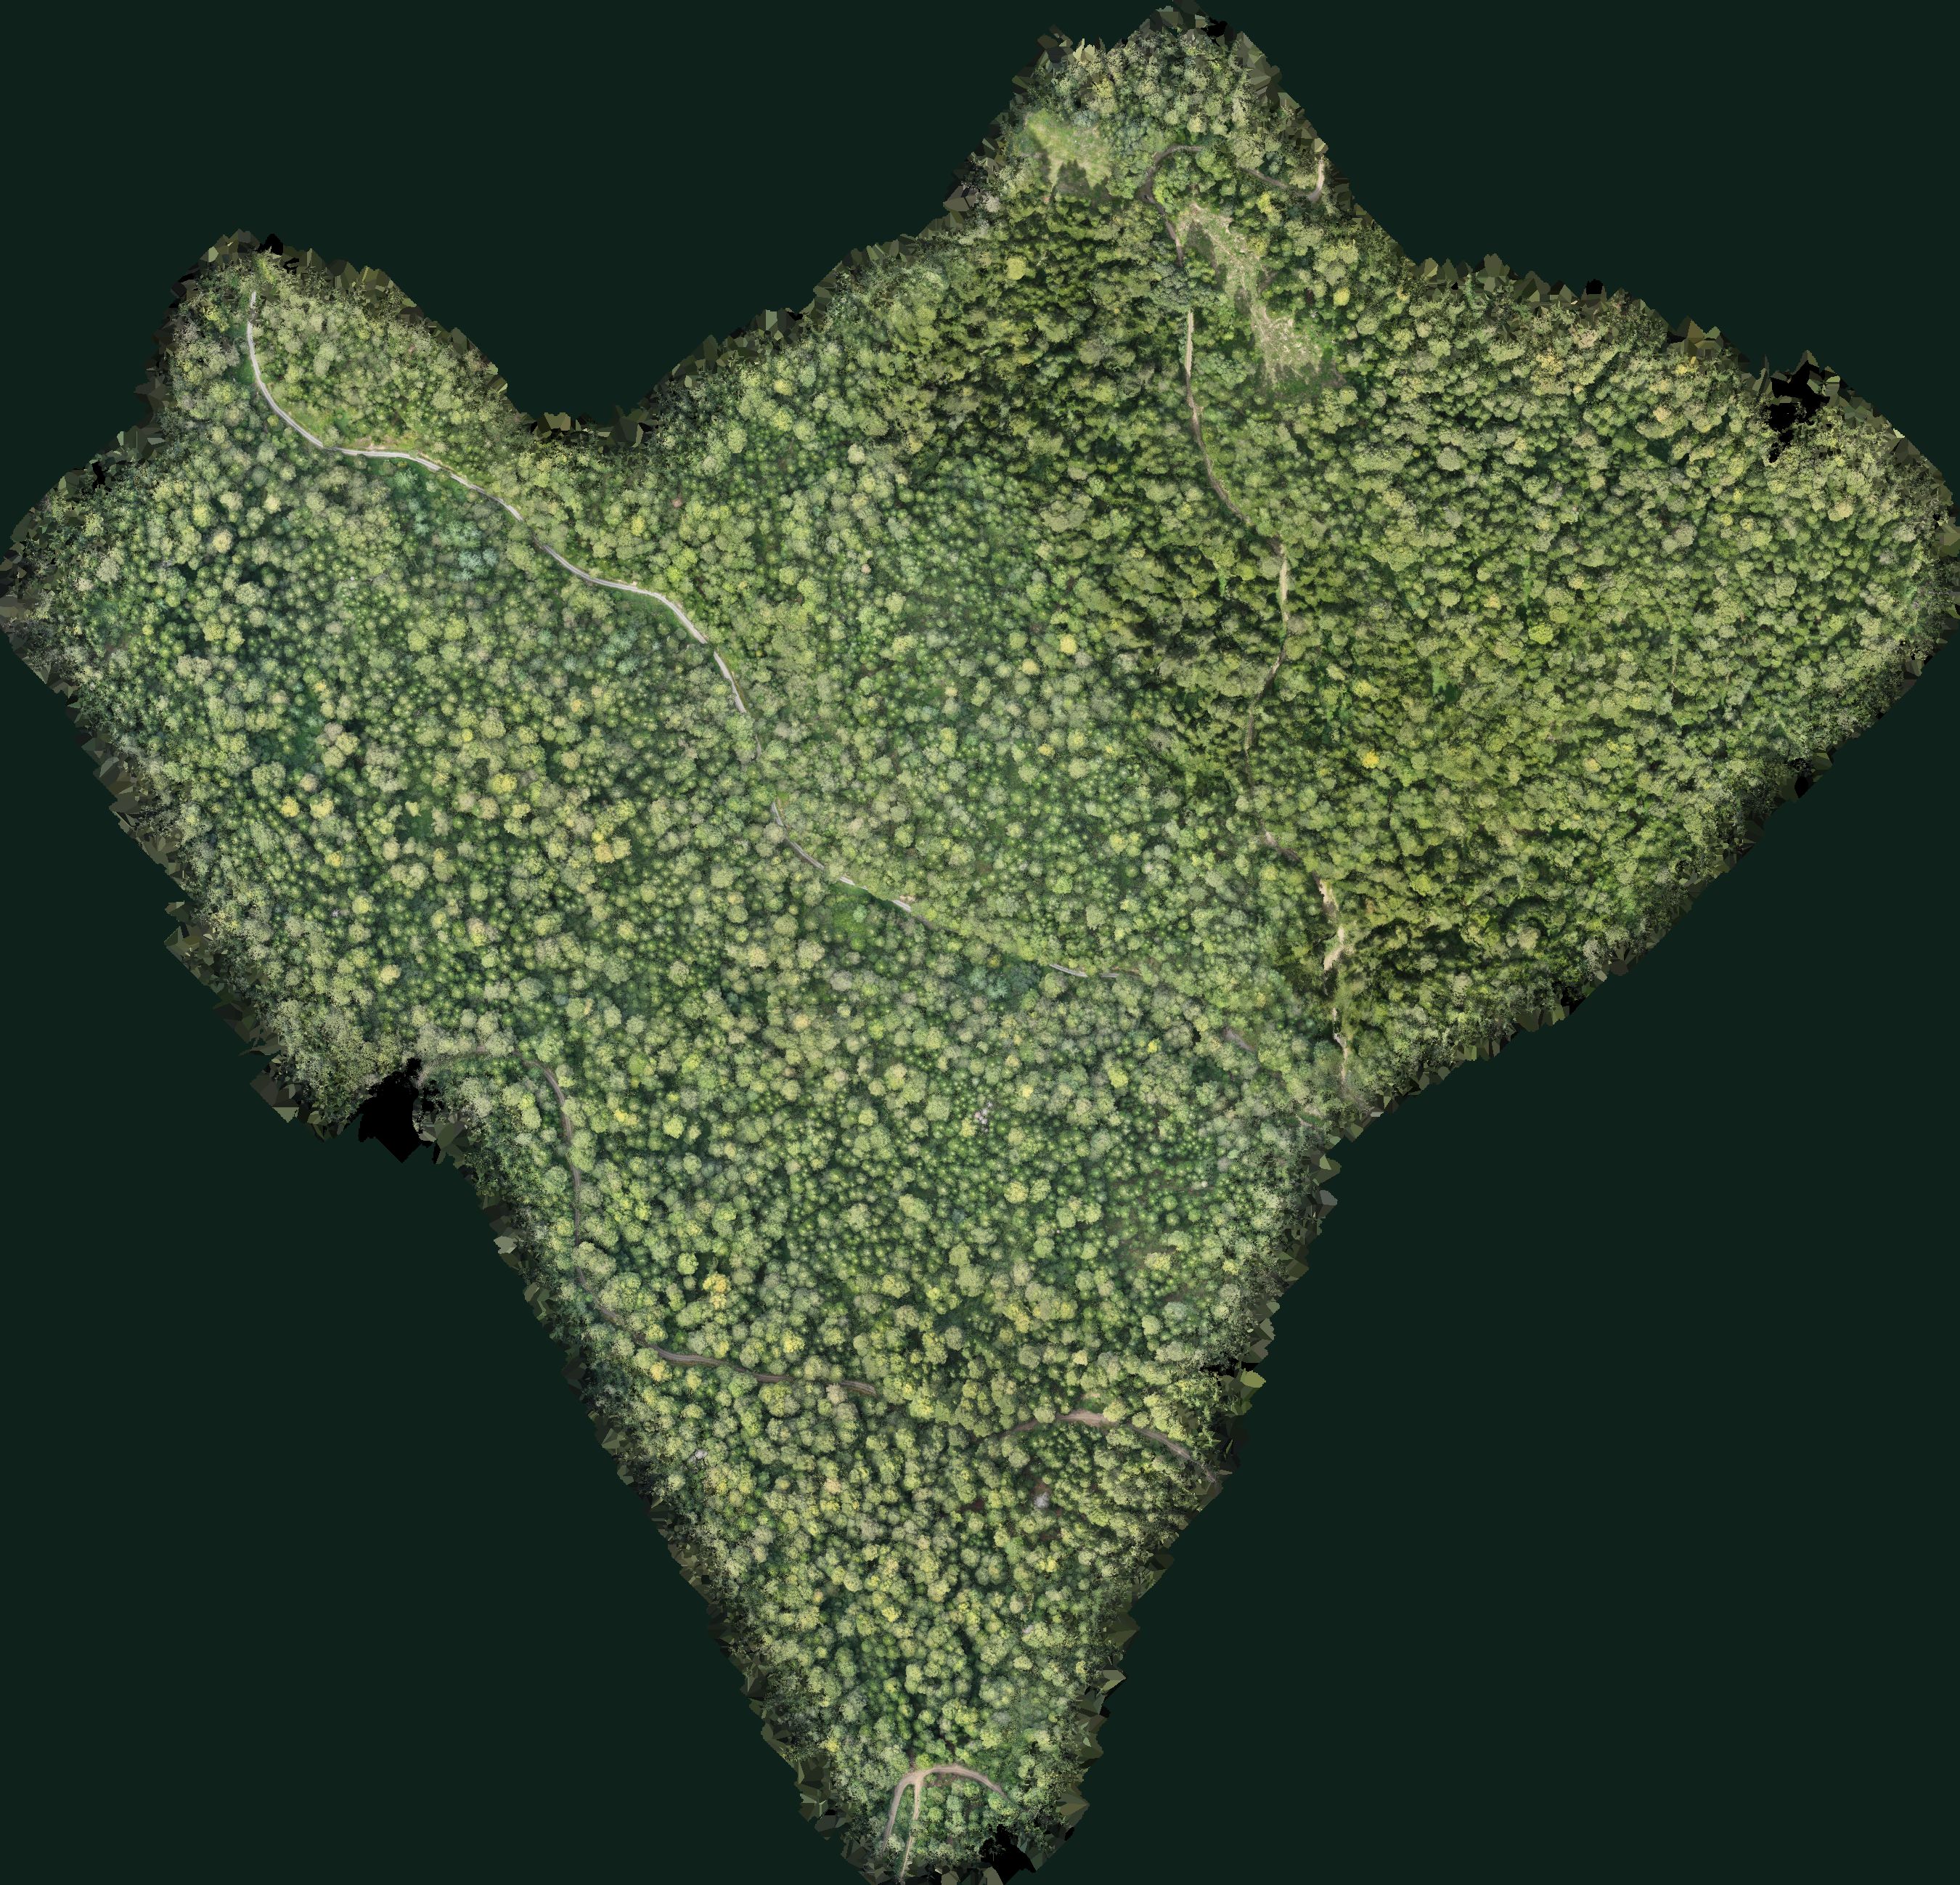
Real data · Goč, 6 September 2024
89.3hasurveyed area
702.5Mmeasured points
787points per m²
20cmterrain and canopy models
Orthophoto of Goč assembled from the colours of the laser points

The image above is not an aerial photo. It is assembled from the colours of 702.5 million laser points, seen from above.

Under the canopy

The laser sees the ground through the forest.

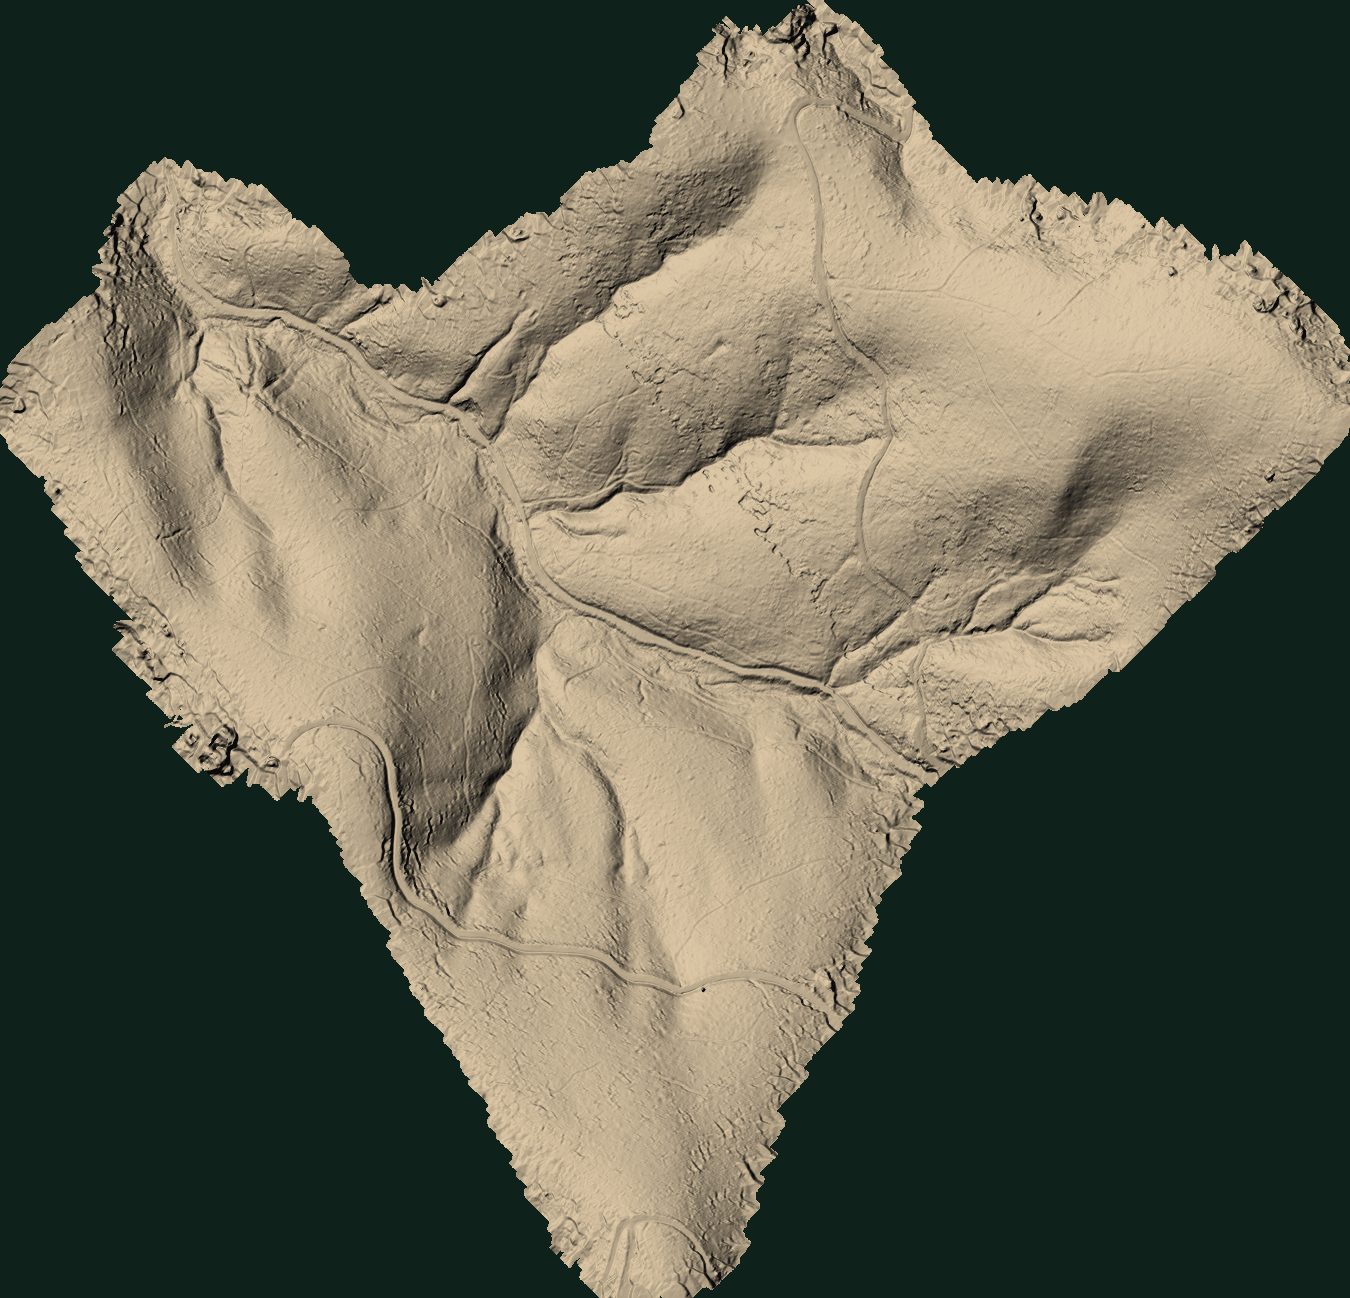
On the left are the tops of the crowns, on the right the terrain beneath them, from the same flight. You can see roads, skid trails, streams and gullies that are never visible from the air. For poplars on a floodplain, this is a map of the hollows where water stands.
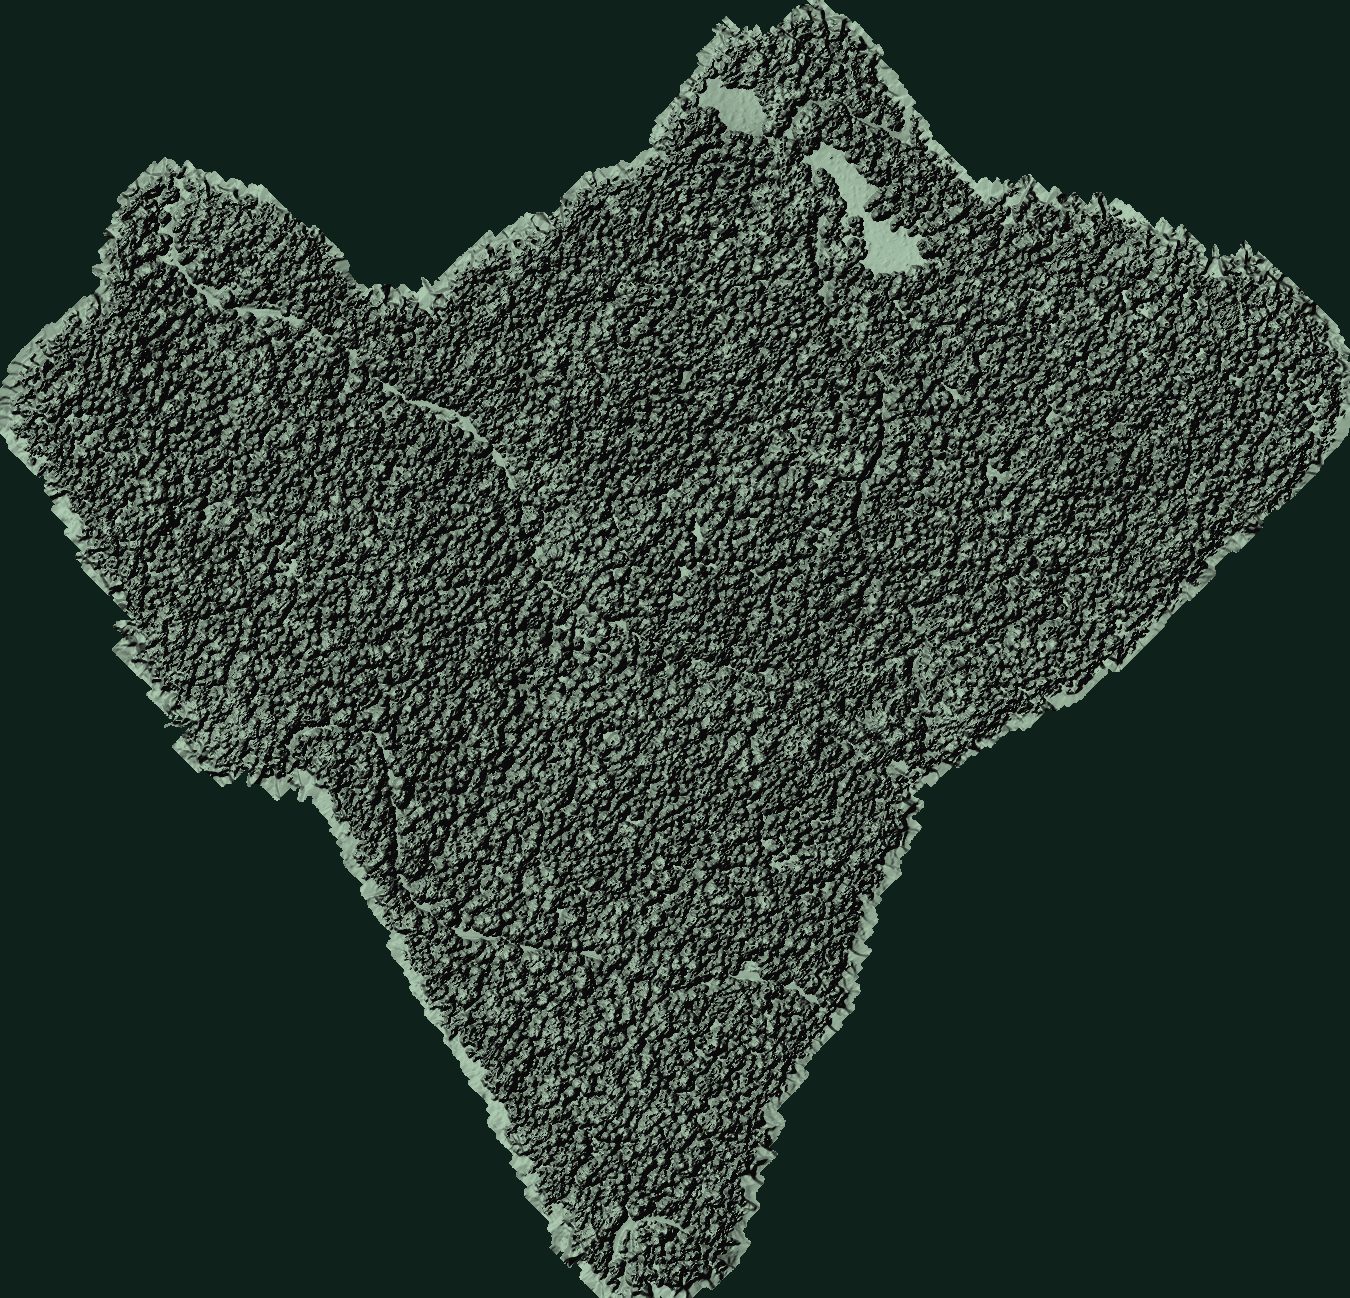
Real data · Goč
Shaded model of the canopy surface
Shaded model of the terrain under the canopy
CanopyGround under the canopy
From cloud to tree

Every tree gets its own location and its own number.

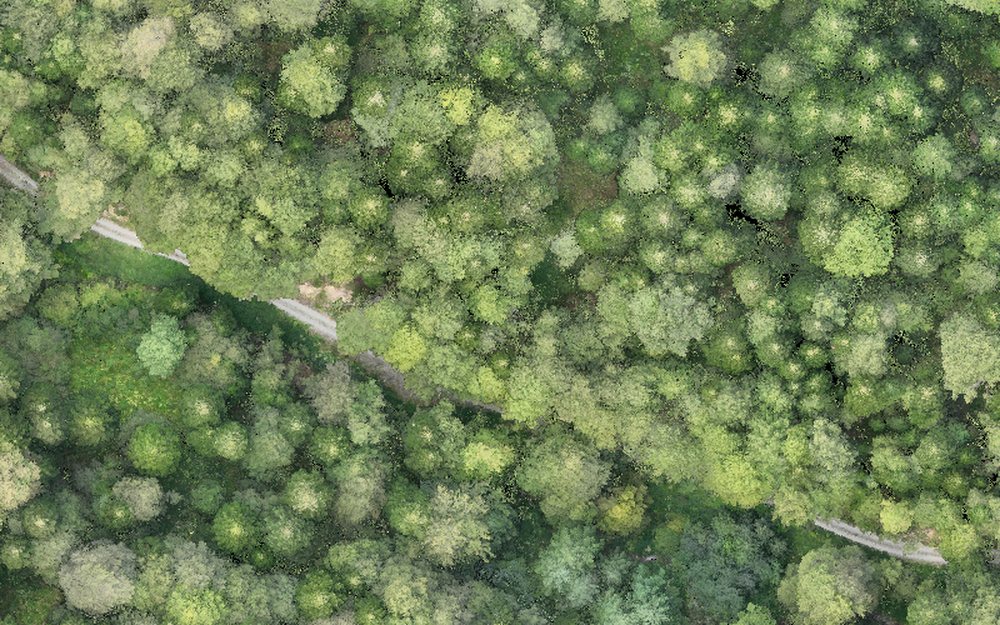
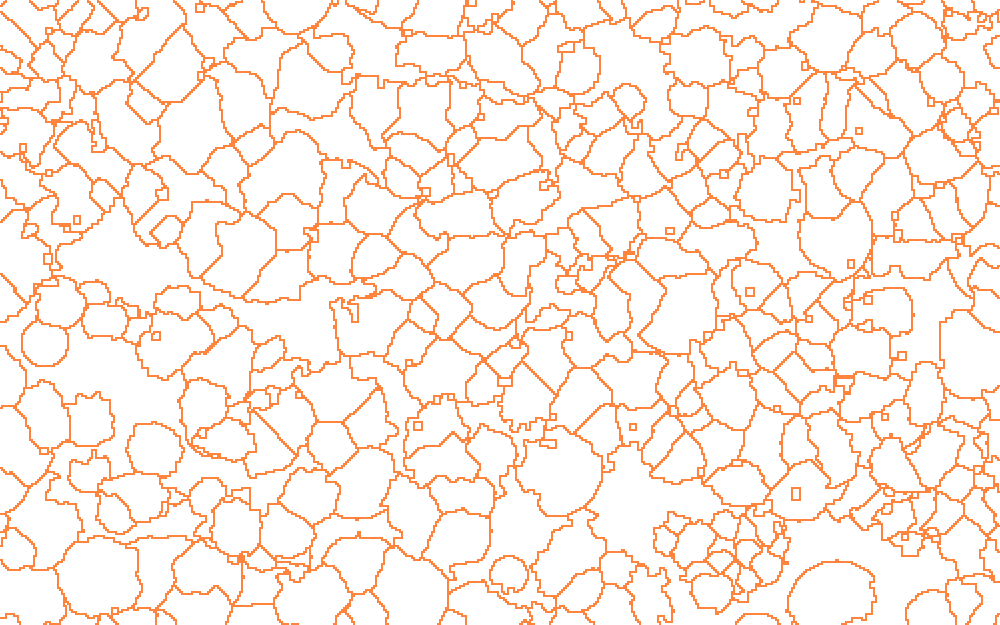
Real data · 2.5 ha extract
Extract of the survey seen from above Crown height above ground Crown boundaries
8,715trees on 89.3 ha
33.3mmedian height
46.0mtallest tree
9.4mtypical crown diameter

We count trees taller than 5 m whose crowns reach the upper canopy. In a single-layer poplar plantation that is every tree. Processing the whole survey takes a few minutes on one computer. The software that comes with the drone gives you points with a height. We deliver the crown, estimated diameter and volume, crown condition and totals per compartment.

Tree by tree

Every colour is one tree.

Real cloud · 760,000 points

Tree

Height
–
Crown diameter
–
DBH (at 1.30 m)
–
Volume
–
Ground elevation
–
estimate

Drag across the cloud to rotate it.
This shows about every 40th point, for speed.
Next screen: one tree at full density ↓

One tree, all points

The view is thinned. The measurement is not.

This is one tree at the full density of the survey, 60 to 150 thousand points. It shows where every number comes from: what the laser measures directly and what is calculated from that.

Real data · full density
Loading points…

From above · crown outline

Stem cross-section

Points by height, 1 m layers

Measured from the points

Calculated from the measurements

The forester's view

Your forest on screen, tree by tree.

This is live, not a picture. Click a crown, colour by height, volume or condition, narrow the selection by height. The totals on the right update instantly.

Real data · 8,715 trees
PREMERGoč management unit · survey 6 September 202489.3 haDBH and m³ are estimates before calibration
Loading 8,715 trees…
From tree to compartment

Totals per hectare, without a single field plot.

A hectare grid over the survey. Each square is the total of the trees inside it. The same works per compartment and sub-compartment once their boundaries are loaded.

Count and heights · measuredDiameter and m³ · estimate

Hectare grid

Height distribution measured

Diameter distribution estimate

Crown condition

The system flags the crowns worth a visit.

The colour of each crown is compared with the green around it. Crowns dominated by grey and brown go on a visit list with coordinates. Here that is 12 of 8,715 trees at Goč.

Real data · a signal to check
  • Today, from the same flight: dead and thinned crowns, fallen and leaning trees, gaps in the canopy.
  • With a multispectral camera: the vitality (NDVI) of each crown, before a change is visible to the naked eye.
  • Across two flights: trees that have stopped growing or lost part of the crown.
  • The decision stays with the forester. The system says where to look, not what the cause is.
Poplar plantations

On poplar all of this works even better.

This is a real poplar plantation in France, surveyed with the same kind of drone and published openly for research. The same plantation in January and in April: in winter the laser sees every stem, once in leaf it sees the crown.

Real data · public survey, France
January · no leaves
April · with leaves
Real data

Empty spots in the grid

From the stem positions the system finds the row direction and planting spacing on its own, then the spots where a tree is missing.

Real data · winter flight

Diameter is measured, not estimated

Without leaves the laser hits the stem from all sides. A circle through the points gives the diameter, compared here with a tape measurement on the same tree.

Real data

Growth from two flights

Same plantation, same drone, two Januaries in a row. Trees that lag behind show up before they die.

Data: Baup, Battista and Frappart (2026), doi.org/10.57745/WAEYEX, Etalab 2.0 licence. The empty spots and diameters are our processing; the heights for growth come from the table published by the authors.

Poplar by poplar

Every tree measured and checked with a tape.

Pick any of the 33 trees. On the left are its points, on the right the stem cross-section and a comparison with field measurements: a tape for diameter, a terrestrial laser for height. Five trees are used for calibration and the rest are the check.

Real data · public survey, France
▁ calibration tree
Loading points…

Stem cross-section

All 33 trees: LiDAR against tape

Height

Stem diameter

How we fly

The flight is planned around what we measure.

Almost any flight will do for height. Not for stem diameter. The rules below come from 22 flights over the same poplar plantation, compared with a tape measurement on every tree.

Published research · 2026

Height and crown

  • Any time of year. Leaves do not change the measured height.
  • Over 1,000 points per m² and at most 60 m above the canopy. At 120 m the height comes out about 1 m too low.
  • Flight speed and direction have no effect.

height error 0.3–0.5 m

Stem diameter

  • In winter, without leaves, and with the understory cleared around the stem.
  • Flight lines parallel to the rows, because the laser then passes between the crowns to the tree.
  • Low, or with a wide margin around the plot: oblique views from the side put points on the stem.
  • Three pulse returns, 80 % overlap, moderate speed.

diameter error 3–4 cm in winter, about 9 cm with leaves

Stem diameter error against tape measurement (RMSE, cm)

Poplar plantation 7 × 8 m, 33 trees, DJI M300 drone with a Zenmuse L1 sensor. GILAB flies the newer L2 and L3 sensors, which have a narrower beam, and a narrower beam inflates the diameter less.
Source: Battista, Frappart, Schwartz and Baup (2026), Annals of Forest Science 83:52, doi.org/10.1186/s13595-026-01371-5. Data: doi.org/10.57745/WAEYEX (Etalab 2.0).

What you get

The tables foresters already use, with a map alongside.

Real totals · Goč
HectareTreesTrees/haTop heightm³/ha *

* estimate from height and crown; it becomes reliable after calibration with 30–50 trees measured in the field.

GeoPackageShapefileExcelPDF reportPoint cloud (LAZ)
Management planTree count, heights and volume per compartment as input, with less fieldwork.
Felling plan and tree markingTrees for felling chosen on the map, with a list and coordinates for the field.
Plantation valueVolume per plot before selling standing timber or taking a loan.
Storm and flood damageFallen and leaning trees after an event, as a record for insurance.
FSC / PEFC certificationEvidence of forest condition and change, with the survey date.
Boundaries and cadastreTrees and plots in the national coordinate system, compared with the cadastre.
Export to the EULocation of the plots the timber comes from, for origin documentation.
CarbonBiomass stock and growth as a basis for calculating stored CO₂.
The service

You show us the plot. We give you back a measured forest.

FLIGHT

A drone with a laser and a camera. No cutting, no marking, no crew in the forest.

this survey: 89.3 ha · 2 h 12 min flight

PROCESSING

Ground, crowns, trees, attributes and totals. Calibrated on your field measurements.

this survey: 702.5 M points · minutes on one computer

VIEWER

A map in the browser, nothing to install. Tables and exports for the software you already use.

what you saw on the previous screens

One survey

A stock inventory: tree count, heights, volume and crown condition, with the viewer and exports.

Summer + winter

For poplars: crown and condition in summer, diameter measured on the tree in winter. The most accurate volume.

Monitoring

A survey every year at the same time. Growth, losses and changes per tree.

Next step

A PILOT ON
YOUR PLANTATION

One plantation, one flight, the result in this viewer.

Plot boundariesFrom a plan or the cadastre, or we draw them together.
One day in the fieldThe flight and, for calibration, 30–50 trees measured with calipers.
Your questionsWhat you need: count, volume, gaps, damage or all of it.

All views marked "Real data" were made from one drone LiDAR survey of Goč (6 September 2024). DBH and timber volume were calculated with a general allometry from height and crown width and have not been calibrated in the field. The poplar screens show a public survey of a plantation in France (Baup, Battista and Frappart 2026, Etalab 2.0 licence) with our processing; the flight rules come from Battista et al. (2026).